
Let's Update County HDIs
Our county Human Development Indices are old

We recently created the Basic Access Index, an indicator that measures population access to basic amenities and infrastructure in the counties. It looked at seven components, including Access to electricity, improved sanitation services, piped water, formal financial services, rural access index, Access to the internet, and healthcare.
However, when creating this index, the initial goal was to come up with a quality of life index that averages the Human Development Index (HDI) and the just-created Basic Access Index. This plan was foiled upon realizing that county HDIs were 10 years old. It didn’t make sense that our quality of life index was an average of a very old measure and a new one. So, we dropped HDI and proceeded to publish the Basic Access Index as a separate measure of wellbeing in the counties.
The relevance of HDI in our quality of life index was based on the fact that in addition to the seven components of the Basic Access Index, HDI adds three more: life expectancy, Gross National Income, and Education. Thus, the index would have ten components, giving us a robust measure of socioeconomic wellbeing in the counties.
After dropping the HDI, however, the next challenge was to try to update it. There were a few limitations. First, we do not have Gross National Incomes by county. Our approach was to use Gross Domestic Product per capita—not the same as GNI, but closer. Second, we don’t have some education metrics like expected years of schooling. Luckily, we have 2022 median years of schooling, which would stand for both mean years of schooling and expected years of schooling. Finally, we were lucky to have 2019 life expectancy figures from the census.
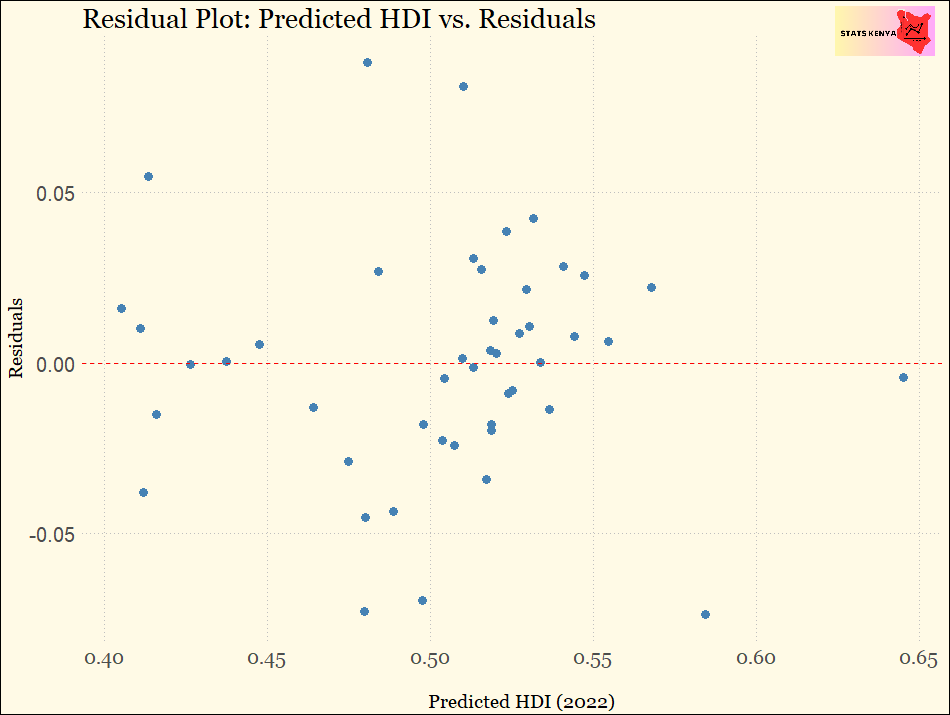
With these data, we can predict 2022 HDIs using regression. First, we have the residual plot below, which tells us whether other variables may be affecting the results of our model. Such variables would be present if our residuals form patterns or curves. In our plot, however, there’s no discernible pattern, and the dots are all over the place - meaning no heteroscedasticity and other devils of regression. Second, most of the dots are closer to zero, meaning the model’s prediction mirrors the actual data, and there’s no huge variance despite the few outliers.
Next, we have three charts that show how the predicted HDIs for each county correlate with each component in the model. From these, we can see the outliers clearly. For instance, in the GCP chart, the furthest dot is Nairobi, and the next one is Mombasa. In the life expectancy chart, the Nyanza counties are far removed from the rest due to the higher prevalence of Malaria and HIV. In the schooling chart, the North Eastern Counties have very low median years of schooling. Overall, the correlations are strong and positive, meaning counties with high predicted HDIs are also likely to have high life expectancies, high levels of education, and high incomes.


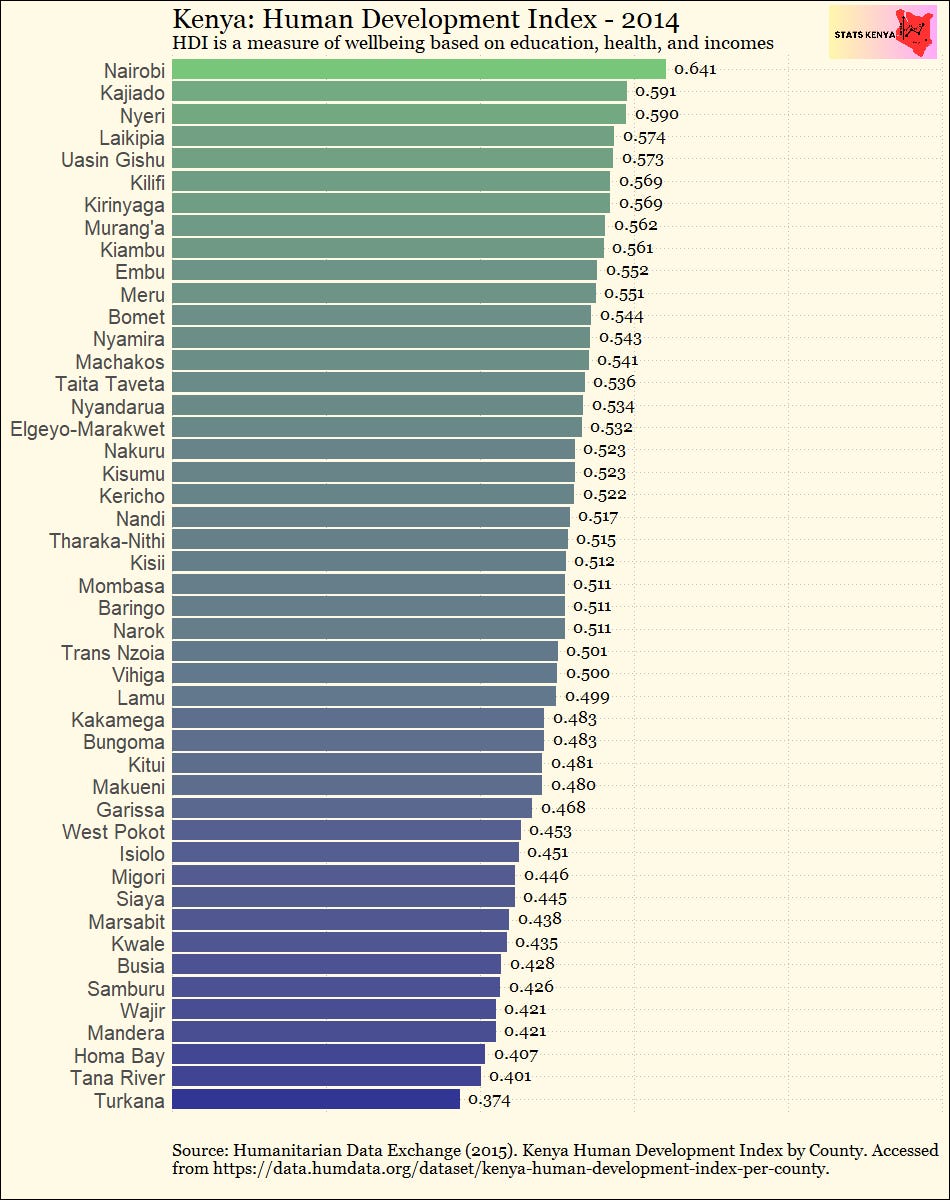
The last step is to estimate the county HDIs in 2022 by applying a growth factor. In this case, we are moving away from prediction to projection, making sure we have estimates for a specific year. To do that, we looked at the most recent HDI values for Kenya from the UN. In 2022, our HDI was 0.601. In 2014, it was 0.52. If the national HDI increased to 0.601 during the ten years, counties must also have undergone some of the transformation. Applying the growth factor slightly adjusts the predicted county HDIs to closely mirror the national HDI in 2022. The result is our final HDI values by county in 2022. Compare them with the 2014 figures in the first chart.
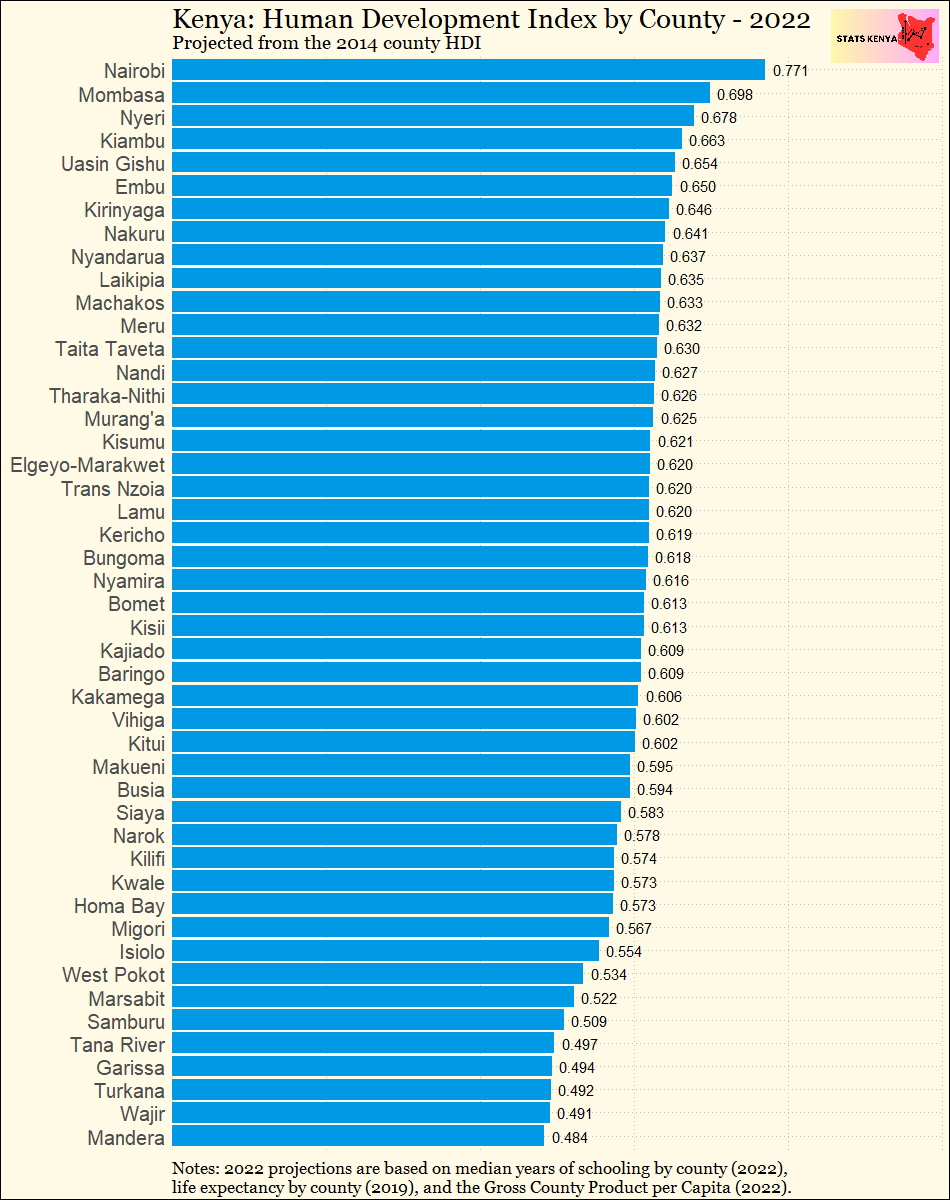
For context, if Nairobi were a country, it would be ranked position 82 in the world - a high human development county. It would be ranked higher than Brazil (0.760), Tunisia (0.732), Egypt (0.728), and South Africa (0.717). On the other hand, Mombasa would be ranked position 120, with Morocco (0.698). Mandera would be position 178 and closer to DRC (0.481).
Finally, the chart below shows the change in HDI between counties. Noteworthy is that all counties saw increased wellbeing in the last decade. The HDI of all counties increased even though some counties saw higher increases than others. However, what changed significantly was the ranking. Some counties were “overvalued stocks” in 2014, while others were undervalued. For instance, from where I sit, there’s no good reason why Kajiado needed to be second in 2014. We can say the same of Kilifi, which had no business being up there. Our 2022 estimates seem to be better at predicting actual county HDIs and appropriately ranking them.

Despite the problems with life expectancy, most Nyanza counties were either undervalued stock or have made significant progress since 2014. Homa Bay and Siaya move up significantly. The same is true of Western counties, which seem to have moved up. Something tells me Mombasa was overvalued in our 2022 estimates. It should be in the top 10 but not second. Most of our indicators, apart from GCP per Capita, don't place Mombasa that high. For instance, our Basic Access Index places it fourth behind Kiambu and Nyeri.